Herramientas de usuario
Tabla de Contenidos
Debugging projects
Introduction
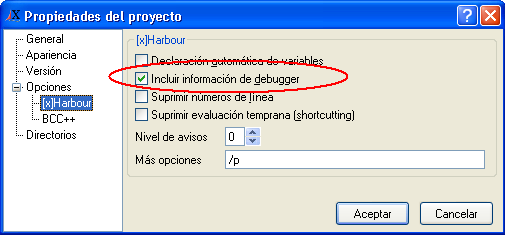
The first thing we have to do is to open our Xailer project and indicate that our programs have to compile with the option “/B”, which, if you recall, is the option that in Clipper activates the debugger, but in Xailer you cannot indicate the compilation flags directly – you have to use the Main Menu of the IDE option: Project/Properties, which will show a form with this appearance:
Select from the tree to the left the option [x]Harbour and mark the box that says “Debug Info”, and afterwards click the OK button.
At the moment, this is the only thing you have to do to indicate that your program should be compiled with debugger information, the famous switch “/b” of Clipper.
So that all of our code can be analyzed by the Xailer debugger, we should recompile the entire project. Press Alt+F9 in the IDE or from the main menu option Project/Compile.


